Organic growth
Both hotels and gaming have high levels of operational gearing due to substantial levels of fixed operating costs. The major driver of long-term organic growth will arise from maximising the revenue generated from the group’s asset base in all macro-economic circumstances.
Operational overheads must be reviewed and measured for efficiency and to ensure each Rand spent is either in support of the objective of sustainability or growth.
Capital expenditure is an important component of both maintaining and improving the group’s facilities and thereby ensuring revenue sustainability and growth.
Key performance indicators
| 2015 | 2014 | |
| Organic income growth | 2% | 6% |
| Organic Ebitdar growth | (3%) | 6% |
| Free cash flow | R1.8 billion | R1.8 billion |
| Maintenance capital expenditure | R749 million | R769 million |
| Adjusted HEPS growth | (1%) | 18% |
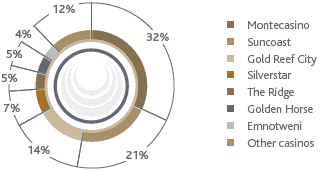
Gaming F’15 Ebitdar by property (%)
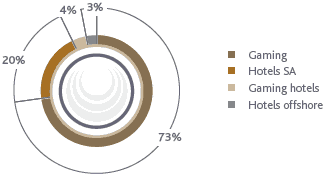
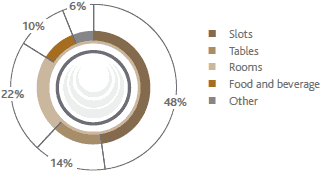
Group F’15 Ebitdar by source (%)
2015 performance
Segmental operating performance
| Income | Ebitdar | Ebitdar margin | ||||||
| Year ended 31 March | 2015 Rm |
2014(2) Rm |
2015 Rm |
2014(2) Rm |
2015 % |
2014(2) % |
||
| Montecasino | 2 510 | 2 415 | 1 133 | 1 088 | 45.1 | 45.1 | ||
| Suncoast | 1 581 | 1 517 | 732 | 717 | 46.3 | 47.2 | ||
| Gold Reef City | 1 270 | 1 298 | 479 | 514 | 37.7 | 39.6 | ||
| Silverstar | 676 | 648 | 248 | 263 | 36.7 | 40.6 | ||
| The Ridge | 415 | 400 | 188 | 186 | 45.2 | 46.5 | ||
| Emnotweni | 367 | 328 | 154 | 144 | 42.0 | 44.0 | ||
| Golden Horse | 334 | 318 | 148 | 146 | 44.3 | 46.1 | ||
| Hemingways | 310 | 336 | 109 | 138 | 35.1 | 41.1 | ||
| Garden Route | 188 | 179 | 79 | 78 | 42.0 | 43.7 | ||
| Blackrock | 152 | 139 | 58 | 54 | 38.1 | 38.8 | ||
| The Caledon | 149 | 135 | 38 | 35 | 25.5 | 25.7 | ||
| Mykonos | 145 | 132 | 64 | 57 | 44.1 | 43.1 | ||
| Goldfields | 138 | 142 | 51 | 57 | 37.1 | 40.3 | ||
| Other gaming operations(2) | 100 | 92 | (216) | (211) | ||||
| Total gaming operations | 8 335 | 8 079 | 3 265 | 3 266 | 39.2 | 40.4 | ||
| South African hotels division(1)(2) | 2 506 | 2 184 | 830 | 752 | 33.1 | 34.4 | ||
| Offshore hotels division | 552 | 550 | 116 | 186 | 21.0 | 33.8 | ||
| Pre-foreign exchange losses/gains | 137 | 153 | 24.8 | 27.8 | ||||
| Foreign exchange (losses)/gains | (21) | 33 | ||||||
| Corporate(1) | (50) | (46) | 12 | 10 | ||||
| Group | 11 343 | 10 767 | 4 223 | 4 214 | 37.2 | 39.1 | ||
| (1) | Includes R50 million (2014: R48 million) intergroup management fees |
| (2) | The StayEasy Century City hotel, previously included in other gaming operations, was transferred to the South African hotels division during the year and generated income of R35 million and Ebitdar of R16 million. (The 2014 comparatives have been restated comprising income of R31 million and Ebitdar of R15 million being reallocated between segments.) |
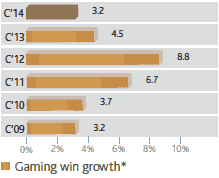
Gauteng
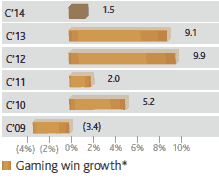
KwaZulu-Natal
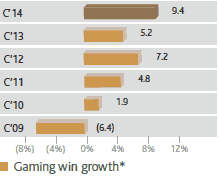
Mpumalanga
Eastern Cape
Western Cape
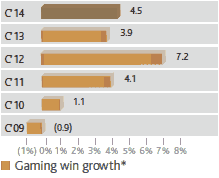
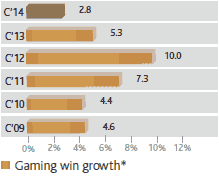
*Based on gambling board statistics (calendar year)
Tsogo Sun gaming
Gaming win for the year in both slots and tables grew by a disappointing 2% on the prior year.| 31 March 2015 Rm |
31 March 2014 Rm |
% change on 2014 |
|||
| Gaming win | 6 976 | 6 819 | 2 | ||
| Tables | 1 573 | 1 542 | 2 | ||
| Slots | 5 403 | 5 277 | 2 | ||
| Win % – tables | 21.8 | 22.0 | (0.2pp) | ||
| Hold % – slots | 5.2 | 5.2 | – |
Gauteng recorded provincial growth in gaming win of 3.6% for the year. Gaming win growth of 4.3% was achieved at Montecasino and 1.7% at Silverstar with Gold Reef City 4.6% down on the prior year. Silverstar and Gold Reef City were adversely impacted by the disruptions as a result of the expansion and refurbishment programmes and the gaming system changes.
KwaZulu-Natal provincial gaming win grew by 4.2% for the year. Gaming win growth of 4.2% was achieved at Suncoast Casino and Entertainment World, 6.3% at Blackrock Casino and 0.6% at Golden Horse Casino.
Mpumalanga reported growth in provincial gaming win of 4.7% for the year. Gaming win growth of 3.5% was achieved at The Ridge Casino in Emalahleni and 9.2% at Emnotweni Casino in Nelspruit following the expansion and redevelopment during the prior year.
The Eastern Cape provincial gaming win grew by 2.2% for the year. Hemingways gaming win was 7.5% down on the prior year due to the poor economic conditions in East London.
The Western Cape reported growth in provincial gaming win of 10.3% for the year. The Caledon Casino, Hotel and Spa, Mykonos Casino in Langebaan and Garden Route Casino in Mossel Bay reported growth of 8.7%, 10.6% and 4.2% respectively.
The Goldfields Casino in Welkom in the Free State experienced difficult conditions with gaming win 2.1% down on the prior year.
Other gaming operations consisting of the Sandton Convention Centre and head office costs reflected a net Ebitdar loss of R216 million, R5 million adverse to the prior year. The StayEasy Century City hotel, previously included in other gaming operations, was transferred to the South African hotels division during the year. The 2014 comparatives in the segment analysis included above have been restated accordingly.
Group revenue by nature (%)
Overall revenue for the gaming division increased 3% on the prior year to R8.3 billion. Ebitdar was unchanged on the prior year at R3.3 billion at a margin of 39.2%, 1.2pp below the prior year due to the slow growth in gaming win and the opening of additional profitable lower margin businesses.
Tsogo Sun hotels
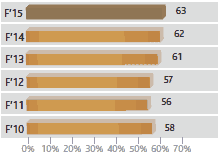
The hotel industry in South Africa, excluding the government segment, continues to experience a recovery from the dual impact of depressed demand and oversupply. Overall industry occupancies have improved marginally to 62.5% (2014: 62.0%) for the year. As a result of the strong sales and distribution channels and the superior product and service quality available within the group, Tsogo Sun hotels continues to achieve an occupancy and rate premium in the segments in which the group operates, albeit at a reduced level as a result of the high exposure of the group to government travel.
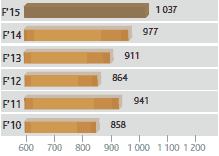
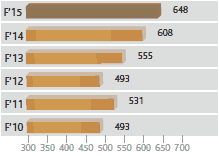
Trading for the group’s South African hotels for the year recorded a systemwide revenue per available room (‘Revpar’) growth of 4% on the prior year due mainly to an increase in average room rates by 6% to R953, with occupancies below the prior year at 62.8% (2014: 63.9%) impacted by the post-election and fiscal austerity impacts on government travel. Overall revenue for the South African hotel division increased 15% on the prior year to R2.5 billion assisted by the inclusion of the additional Cullinan hotels offset by the sale of Garden Court Sandton in December 2013 and the closure of Garden Court De Waal for four months during the year for refurbishment. Ebitdar improved 10% to R830 million at a margin of 33.1% (2014: 34.4%).
The offshore division of hotels achieved total revenue of R552 million, unchanged on the prior year due to the closure of Southern Sun Maputo for five months during the year for refurbishment and particularly the impact of the Ebola pandemic on trading and the uncertain political environment in certain countries. This was offset by the acquisition of Southern Sun Ikoyi on 29 June 2013, giving a full 12 months trading in 2015, and the weakening of the Rand against both the US Dollar and the Euro. Ebitdar (pre-foreign exchange losses or gains) decreased by 10% to R137 million. Foreign exchange losses of R21 million (2014: R33 million gain) were incurred on the translation of offshore monetary items.
Combined South African and offshore hotel trading statistics for the year, reflecting the Tsogo Sun group-owned hotels and excluding hotels managed on behalf of third parties, are as follows:
| 31 March | 31 March | |
| 2015 | 2014 | |
| Occupancy (%) | 61.6 | 63.6 |
| Average room rate (R) | 945 | 897 |
| Revpar (R) | 583 | 570 |
| Rooms available (’000) | 4 209 | 3 892 |
| Rooms sold (’000) | 2 595 | 2 476 |
| Rooms revenue (Rm) | 2 453 | 2 221 |
The increase in average room rate is positively impacted by the inclusion of Southern Sun Ikoyi from 29 June 2013 and the effect of the Rand weakness on the offshore portfolio.
Maintenance capital expenditure
The group invested R749 million on maintenance capex group-wide, including gaming system replacements and major hotel refurbishments, ensuring our assets remain best in class.
Looking ahead
The underlying operations of the group remain highly geared towards the South African consumer (in gaming) and the corporate market (in hotels) with both sectors still experiencing difficult economic conditions and increased administered costs. The high level of operational gearing still presents significant growth potential for the group should these sectors of the South African economy improve.
Trading is expected to remain under pressure due to the ongoing macro-economic conditions and weak consumer sentiment. Nevertheless, the group remains highly cash generative and is confident in achieving attractive returns from the growth strategy once the macro-economic environment improves.
SA occupancy*
SA average rate*
SA Revpar*
* South African hotel industry based on STR Global statistics